RL Ryan Leem
LA / UCLA / 2029

Ryan Leem / UCLA Data Science

Ryan Leem

Data Science at UCLA

I'm a UCLA Data Science student. So far, I've built projects in semantic search, fraud analytics, reporting automation, and AI evaluation.

Most of my work has moved between the data, the implementation, and the parts that break along the way.

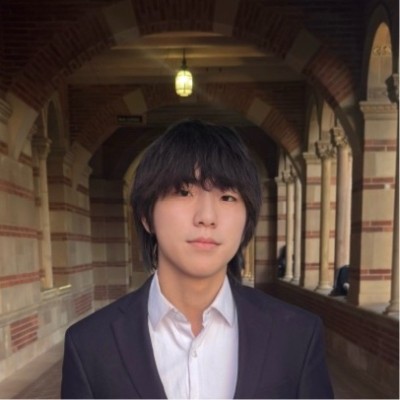
Ryan Leem portrait

I work across the data and the implementation.

I'm a Data Science student at UCLA with hands-on experience across semantic search, fraud analytics, AI evaluation, reporting automation, and data analysis. I work mainly with Python, SQL, and R, and most of my experience has come from building projects where I have to work through the data, the implementation, and the parts that break along the way.

So far, I've built a semantic search system for GitHub issues, analyzed fraud patterns across 1 million bank applications, automated a multi-million-row banking reporting workflow, worked on e-commerce conversion analysis in R, and developed AI benchmark tasks at Handshake AI.

February 2026 – Present

AI Benchmark Developer

Handshake AI

At Handshake AI, I develop coding benchmark tasks used to evaluate AI systems. I've built more than 30 tasks using Python and shell scripting, created Docker-based environments, and written automated verifier tests to check correctness and reproducibility.

A large part of the work involves debugging evaluator failures and revising task logic when something does not behave the way the specification expects. That has pushed me to pay close attention to edge cases, reproducibility, and whether something actually works the way it is supposed to.

30+Coding benchmark tasks
Python + ShellTask development
DockerReproducible environments
Automated VerifiersCorrectness testing
evaluation
systems

GitHub Bug Finder

View on GitHub
11,336issues indexed
70% → 80%top-result accuracy
20paraphrased queries tested

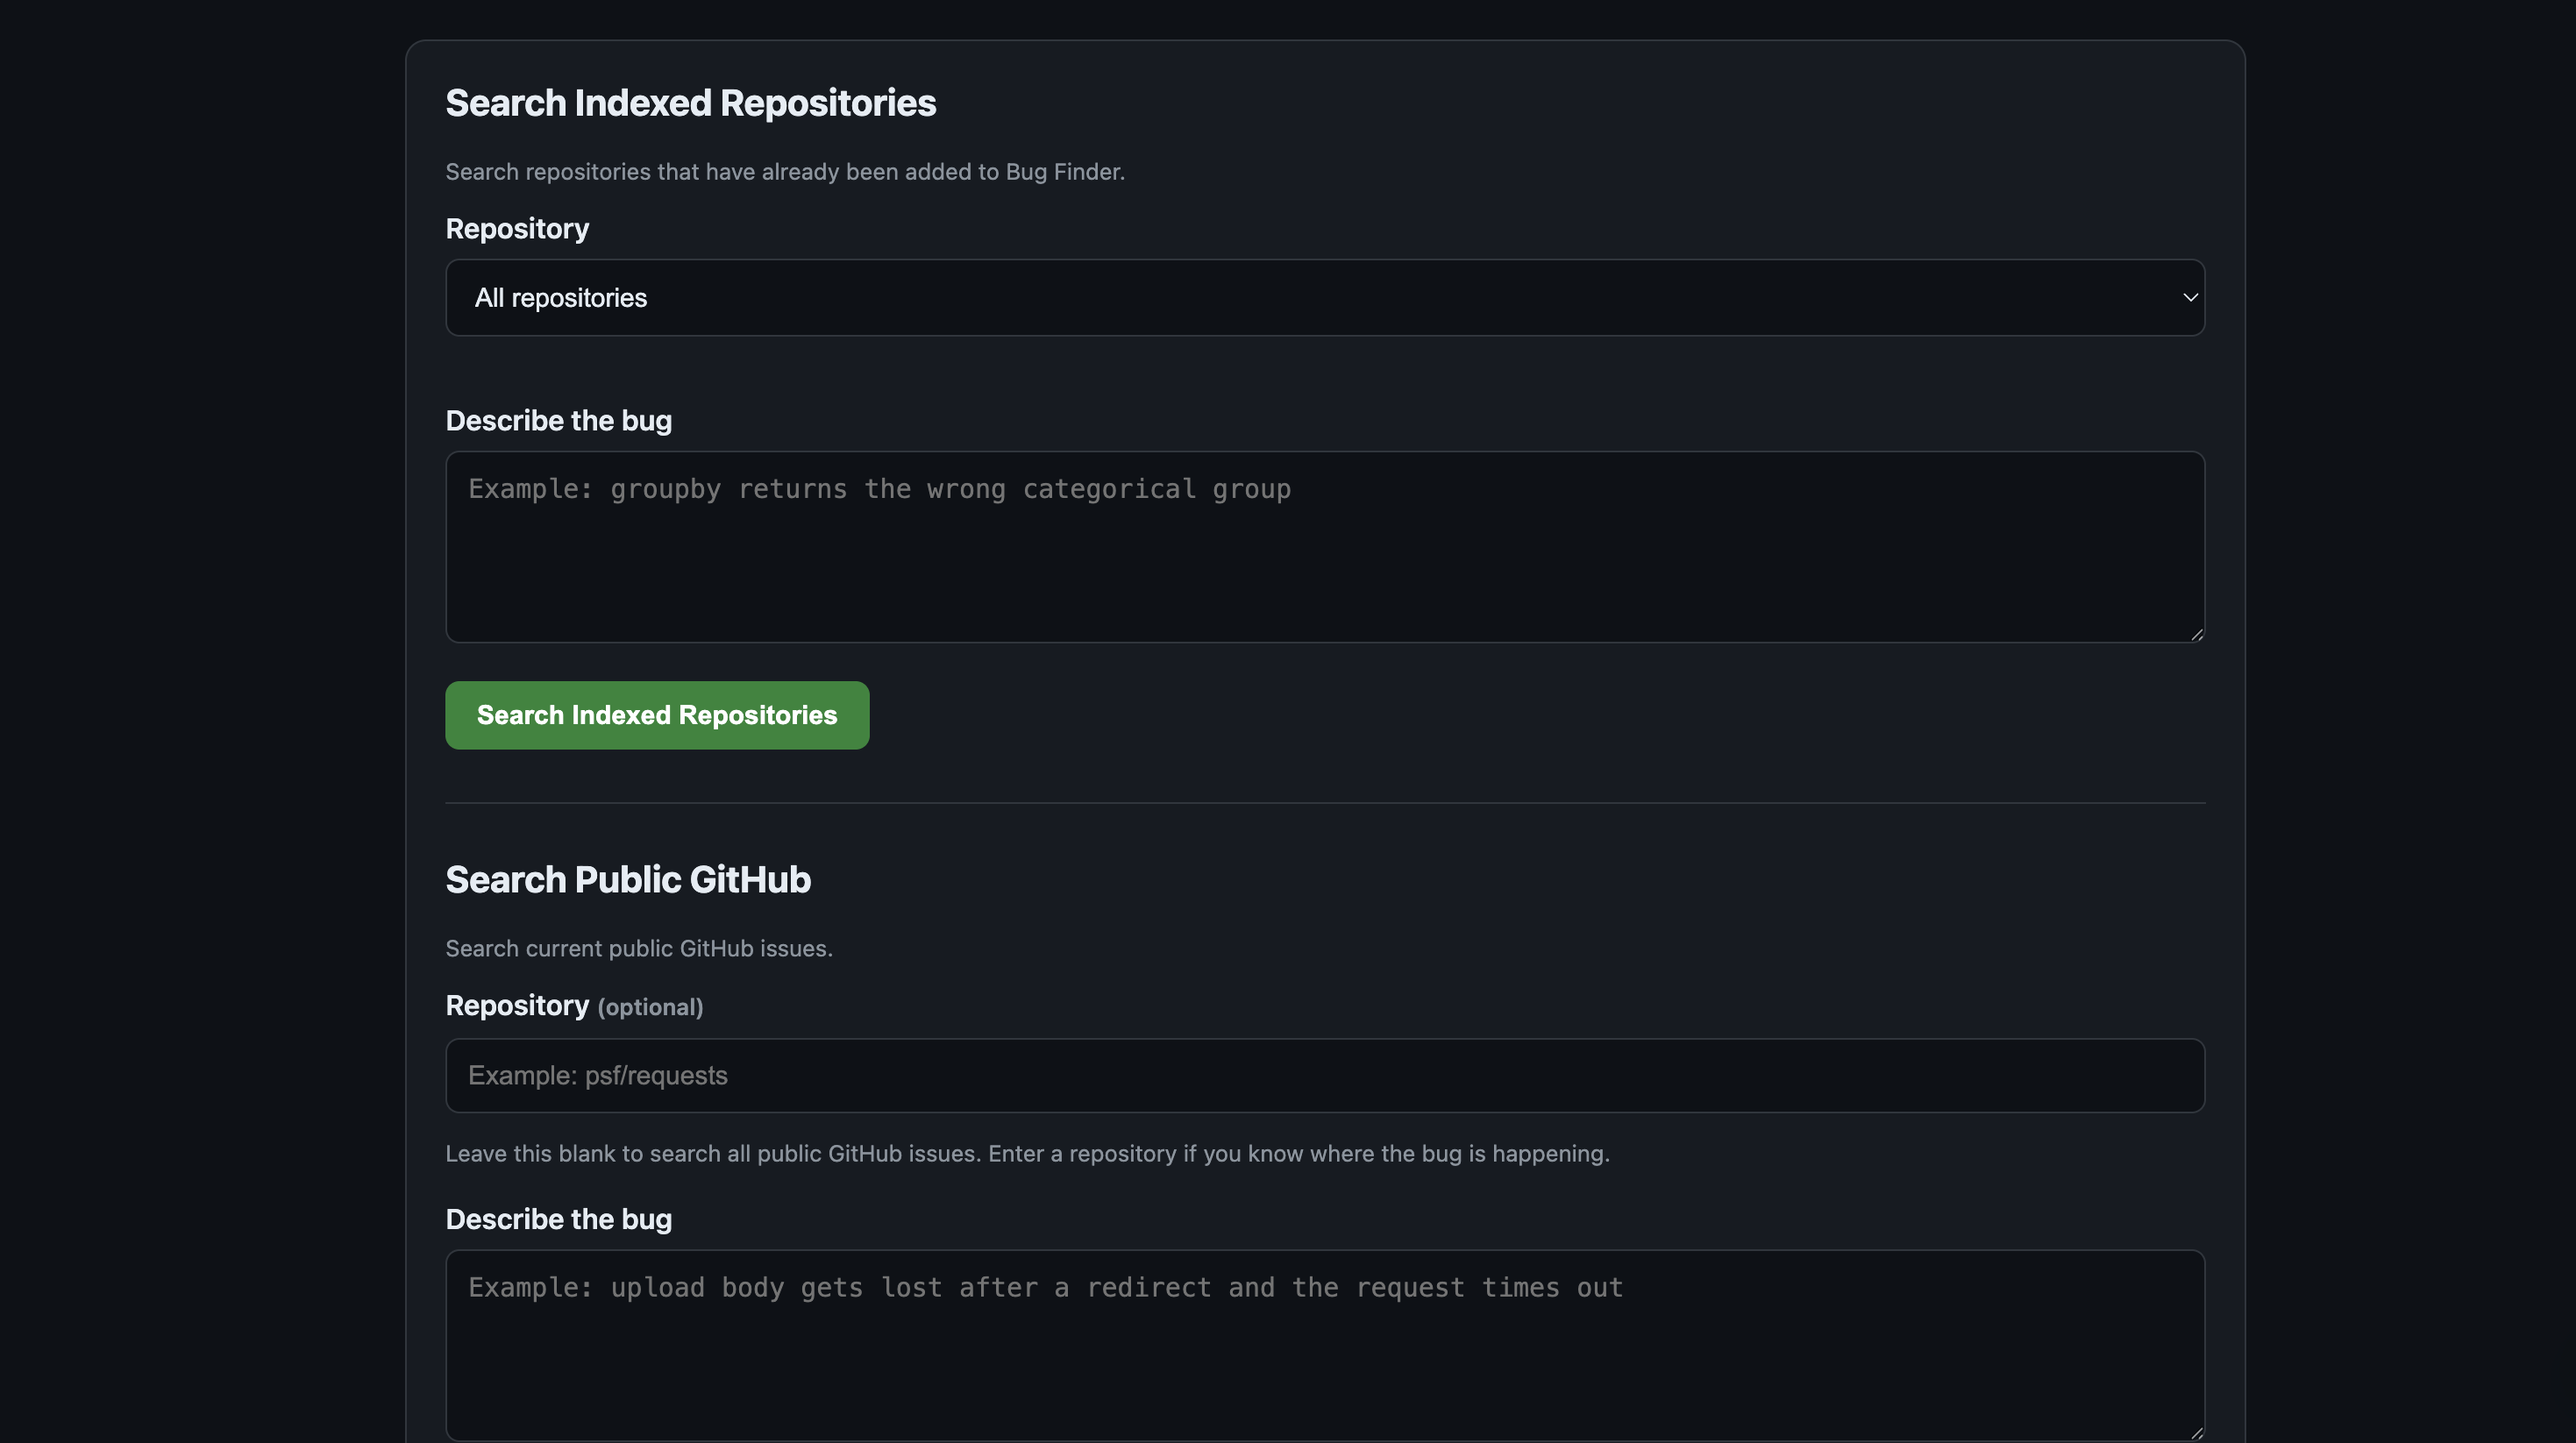
I wanted to make it easier to find existing GitHub issues when I only knew how to describe a bug in plain language. I built a semantic search tool that indexes 11,336 bug reports and can retrieve current public issues through the GitHub API.

I collected and cleaned the issue data, generated sentence embeddings, stored them in PostgreSQL with pgvector, and added title-aware reranking with a FastAPI search path. On 20 paraphrased tests, the top result improved from 70% to 80%, and I learned that titles carry useful signal when an issue body is vague.

GitHub Bug Finder search screen

Bank Account Fraud Risk Analytics

View on GitHub
1Mapplications analyzed
11.74%fraud-rate segment
10x+baseline lift
6–7 msindexed query

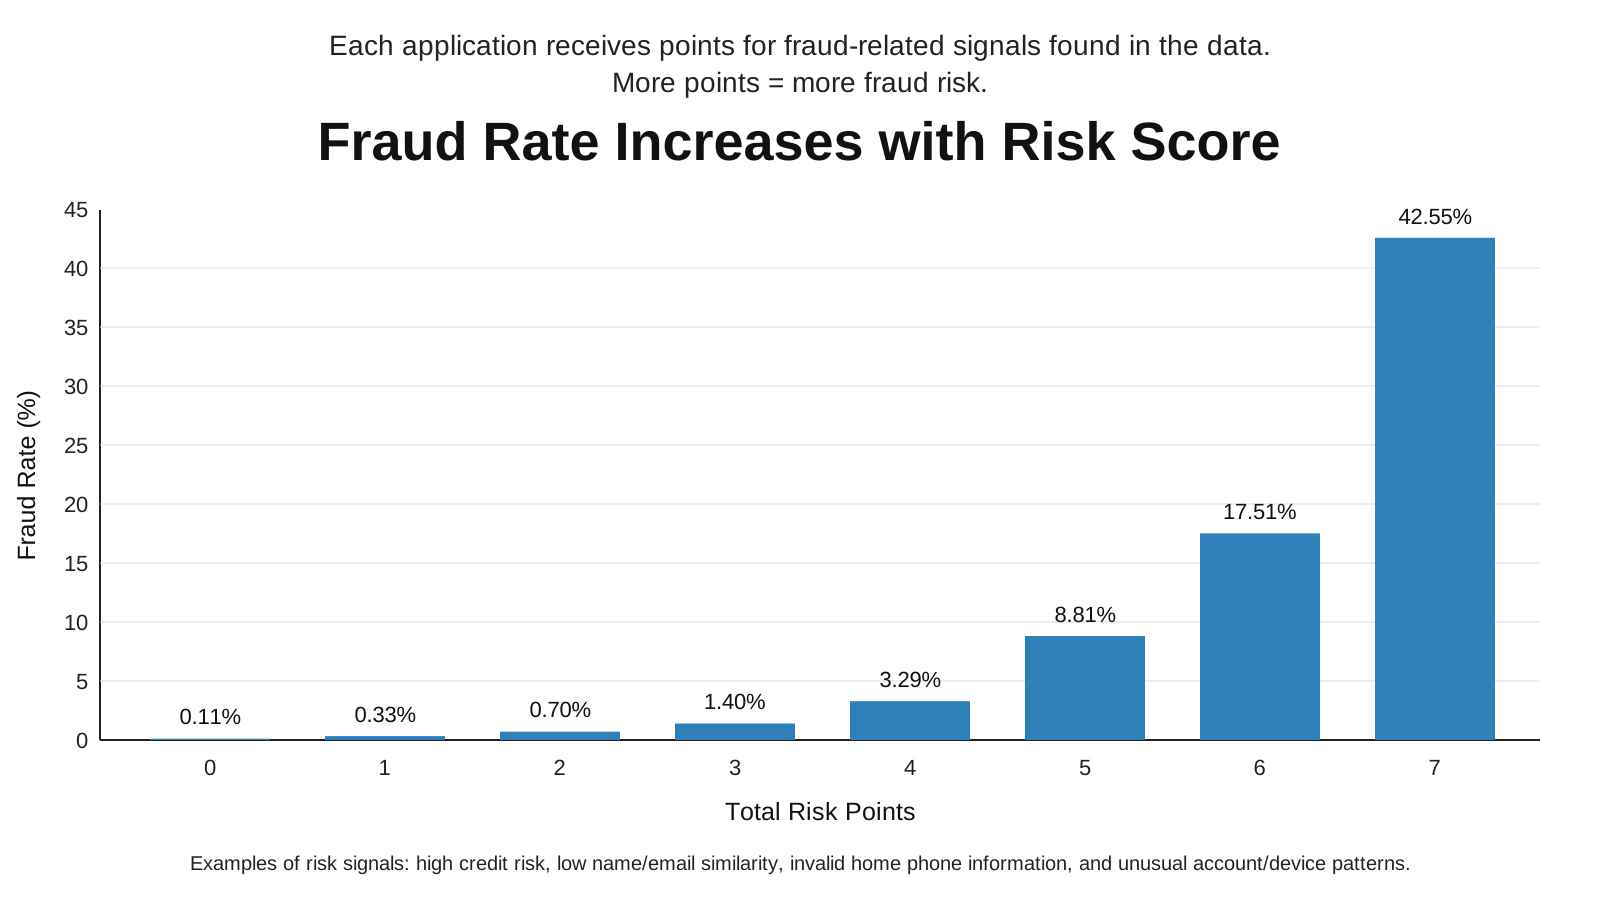
I wanted to find which bank account applications looked most likely to be fraudulent instead of treating every application the same. I analyzed 1 million applications in PostgreSQL and built a rule-based risk score that groups accounts by warning signs.

I wrote the SQL with CTEs, indexed the fields used by the score, and checked query plans with EXPLAIN ANALYZE. The highest-risk segment had an 11.74% fraud rate—more than 10x the baseline—and the indexed query ran in about 6–7 ms. This showed me how much a simple, explainable score can reveal before adding a more complex model.

Fraud rate by risk score from the Bank Account Fraud Risk Analytics project

Banking Performance Report Analyzer

View on GitHub
Multi-million-rowtransaction data
Automatedrefresh workflow
Power Query + VBAreporting stack

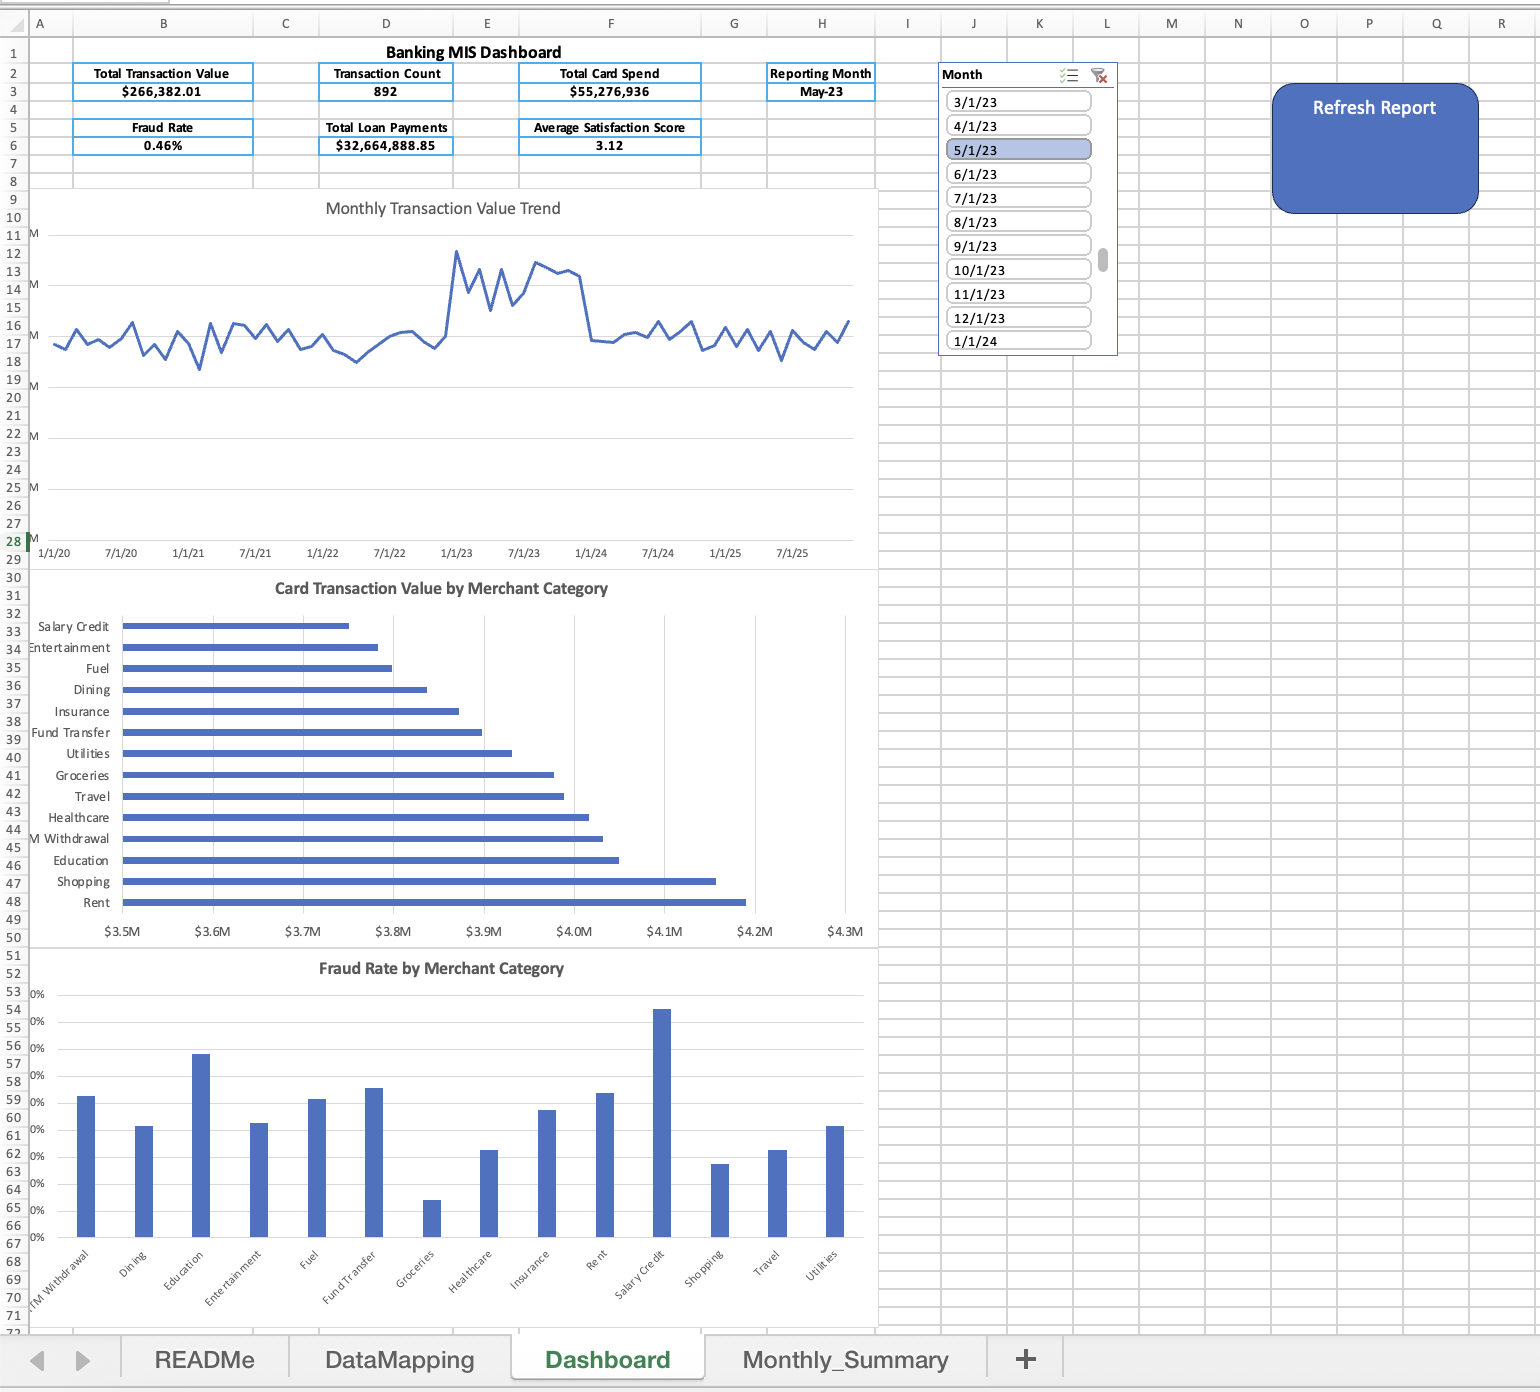
I wanted to turn a slow, repetitive monthly banking report into a workflow that could handle more rows than Excel can hold in one worksheet. I built a reporting process that aggregates multi-million-row transaction data before loading the results into an Excel dashboard.

I wrote the Power Query transformations, set up the PivotTables and PivotCharts, added VBA for one-click refreshes, and used a CSV mapping layer to keep the inputs reusable. The result made the report repeatable without forcing the full raw dataset into Excel, and it taught me to solve scale limits before they become spreadsheet problems.

Banking MIS dashboard from the Banking Performance Report Analyzer project

E-Commerce Funnel & Conversion Analysis

View on GitHub
500K+interactions
R² = 0.0845regression fit
p = 0.335regression test

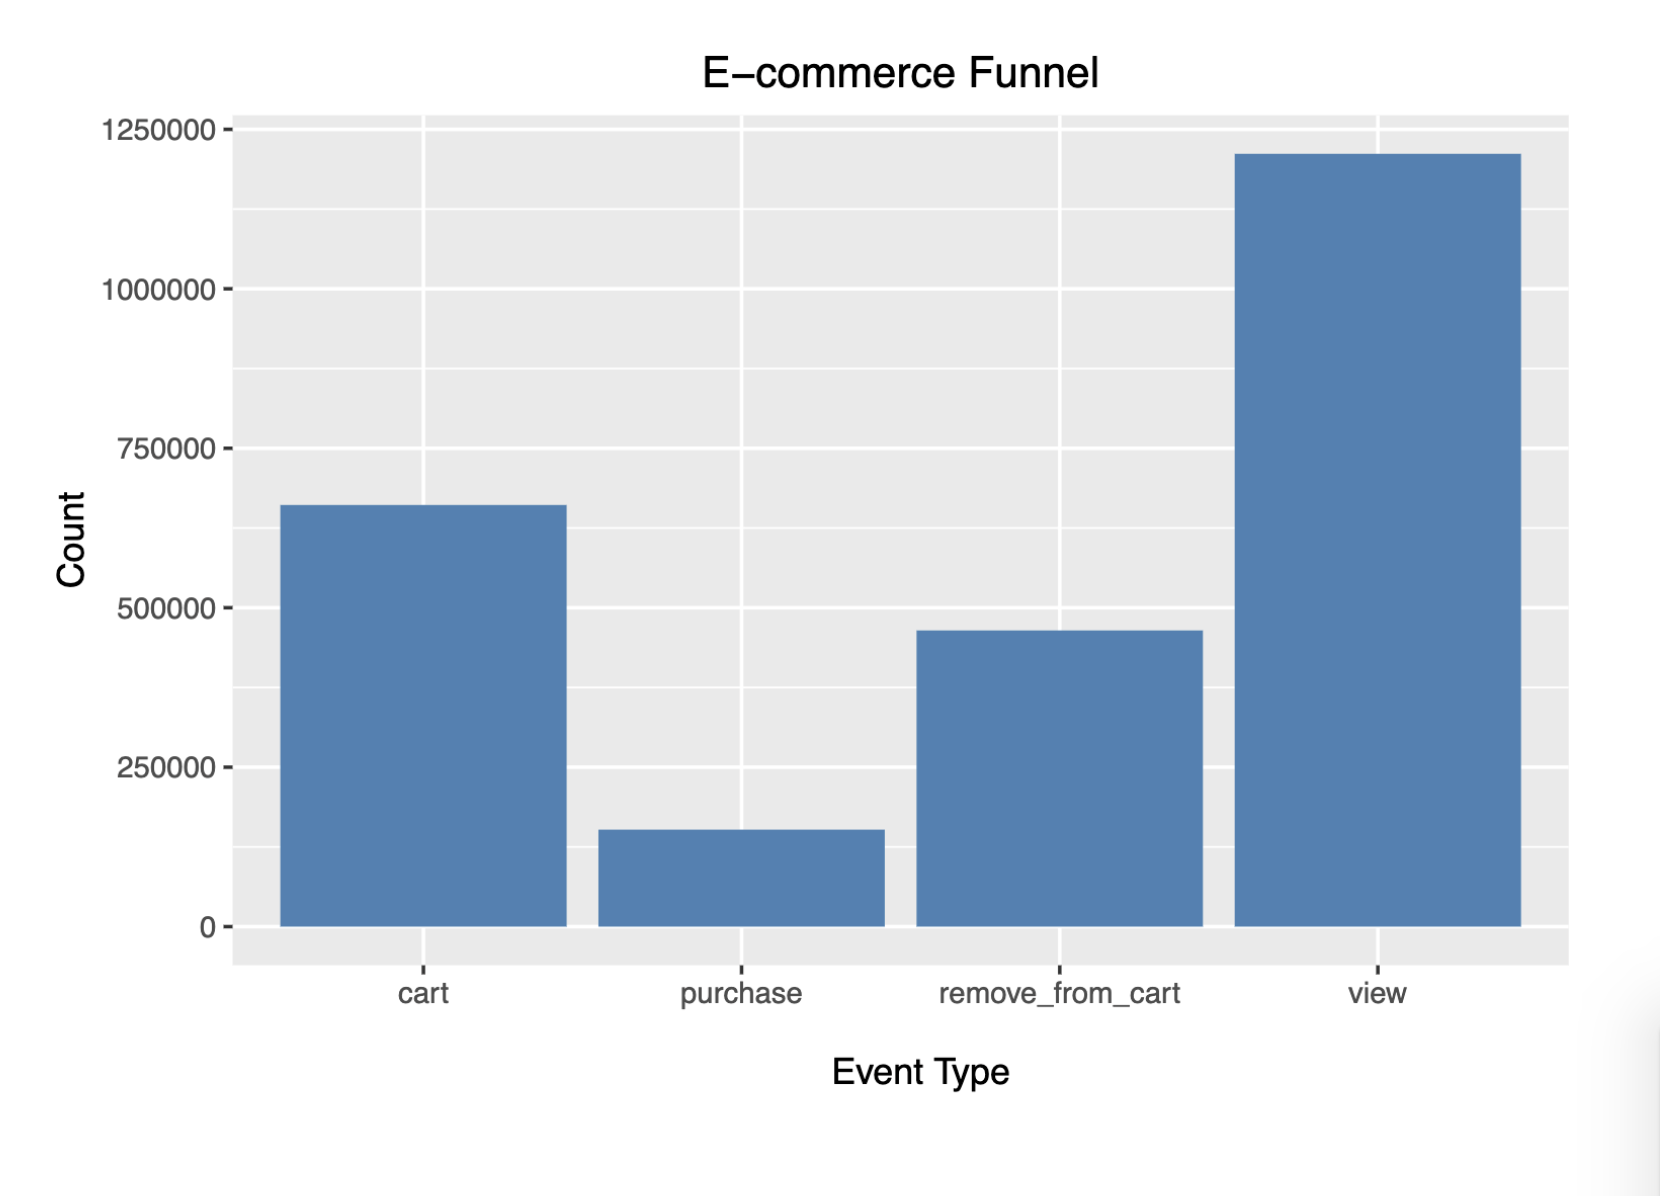
I wanted to understand where customers were dropping out of an e-commerce funnel and whether brands with more traffic were also converting better. I analyzed more than 500,000 interactions in R and compared funnel steps and conversion rates across brands.

I cleaned and grouped the event data with tidyverse, built funnel charts with ggplot2, and ran a regression to test the relationship between traffic and conversion before filtering to high-traffic brands. The regression had an R² of 0.0845 and a p-value of 0.335, so traffic alone did not explain conversion well; comparing brands on more than volume gave me a more careful way to read the funnel.

E-commerce funnel chart from the E-Commerce Funnel and Conversion Analysis project

University of California, Los Angeles (UCLA)

B.S. Data Science (Intended)

Expected 2029

Programming

PythonSQLRLuau

Databases & Data

PostgreSQLPandastidyverseData CleaningExploratory Data AnalysisRegression Analysis

AI / Evaluation

Semantic SearchEmbeddingssentence-transformersBenchmark DevelopmentAutomated TestingModel Output Evaluation

Analytics & Reporting

ExcelPower QueryPivotTablesPivotChartsVBAggplot2Matplotlib

Development

GitGitHubDockerFastAPIREST APIs

Languages

EnglishKorean

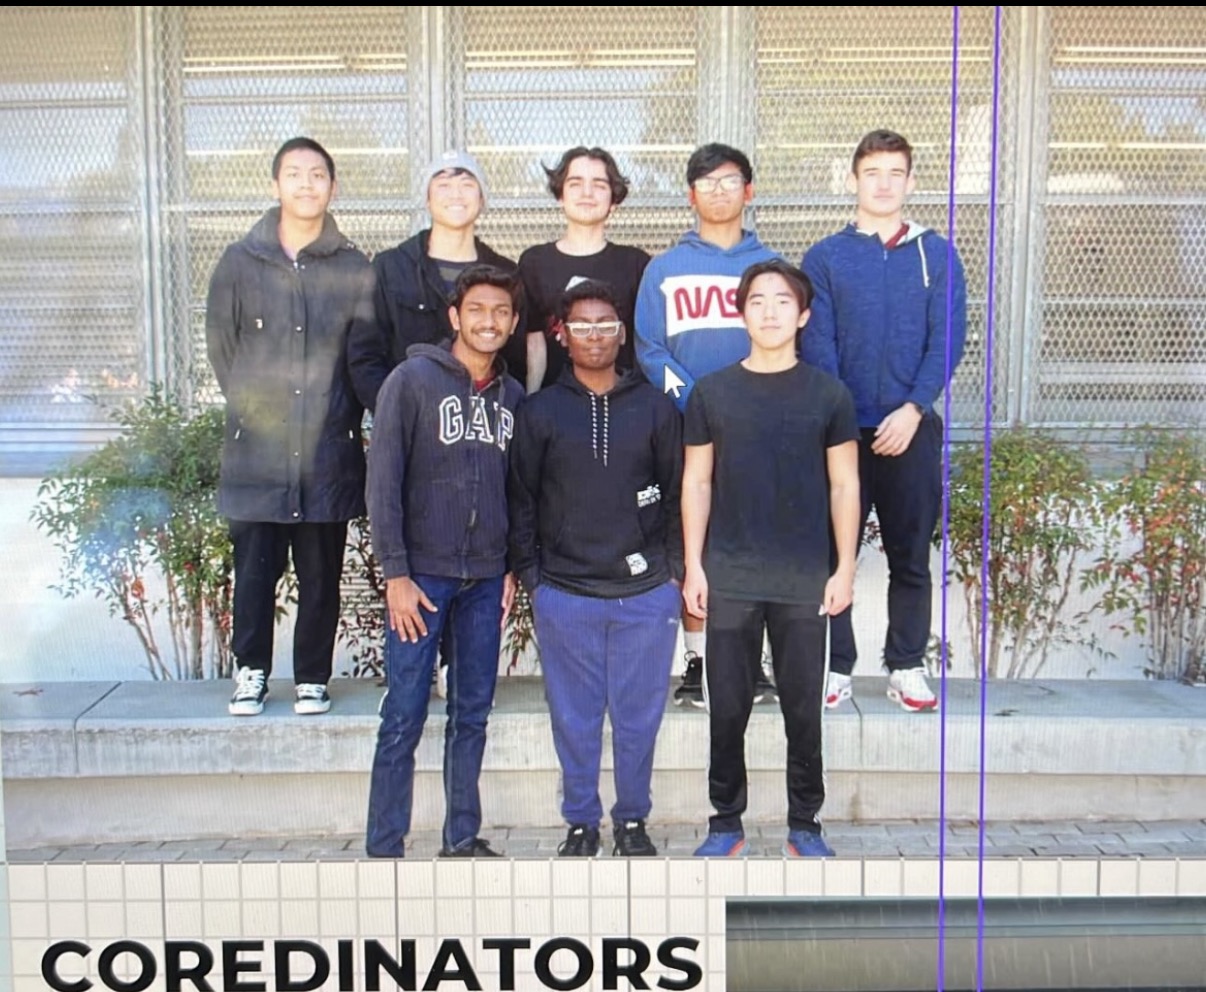
Outside of my technical work, I've also spent time leading student and volunteer groups. Those roles gave me experience helping people, organizing projects, and taking responsibility for things beyond my own individual work.

Coding Club coordinator group photo

Coding Club

Vice President

I helped teach Python, but I also wanted the club to stay fun instead of feeling like another class. One way I did that was helping members run their own Minecraft servers and experiment with things like designing custom mobs and changing how the game worked. It gave people a way to learn programming by building something they were already interested in.

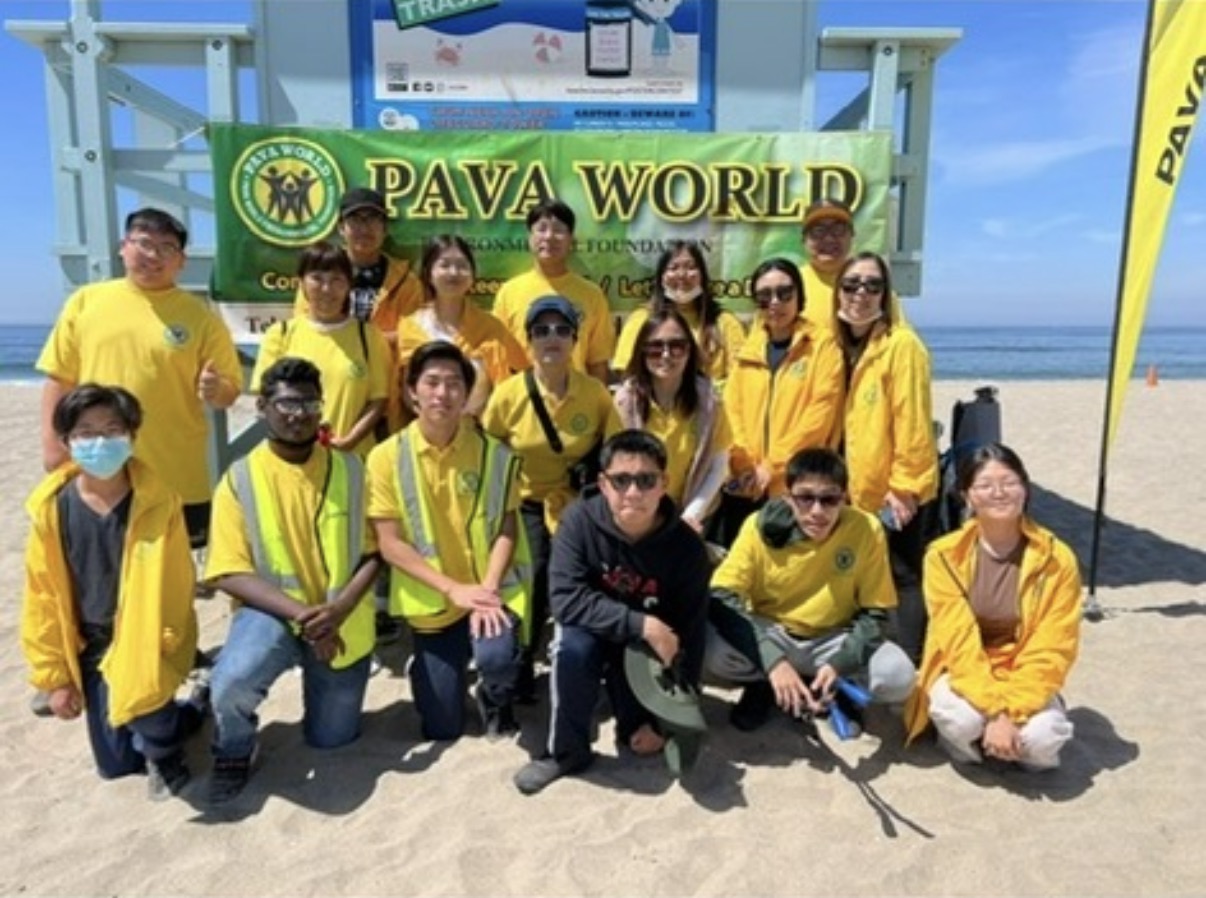
PAVA World volunteer group photo at the beach

PAVA

District President

As District President, I led a group of around 16 people, kept everyone updated on upcoming volunteer events, explained what we needed to do, and helped newer members understand how the organization worked. I also participated directly in the events, including picking up trash at beaches, parks, and schools and helping plant new plants in the community.

Read the full resume.

I'm a UCLA Data Science student with experience across semantic search, fraud analytics, AI evaluation, reporting automation, and data analysis. I work mainly with Python, SQL, and R, and most of my experience has come from building projects where I have to understand the data, build the system around it, and work through the parts that do not behave the way I expected.

My resume goes into more detail on my work at Handshake AI, my technical projects, leadership experience, and the tools I've used across them.

Open resume

Let's talk about the work.

I'm most interested in work where I can actually get into the data, understand the problem, and help build the thing that solves it. I like being involved in both the analysis and the implementation rather than only looking at one side of the project.

So far, that has meant working on things like semantic search, fraud analysis, reporting automation, and AI evaluation. I want to keep moving toward roles where I can keep building that kind of experience while contributing technically from the start.